Evolutionary Coupling Analysis
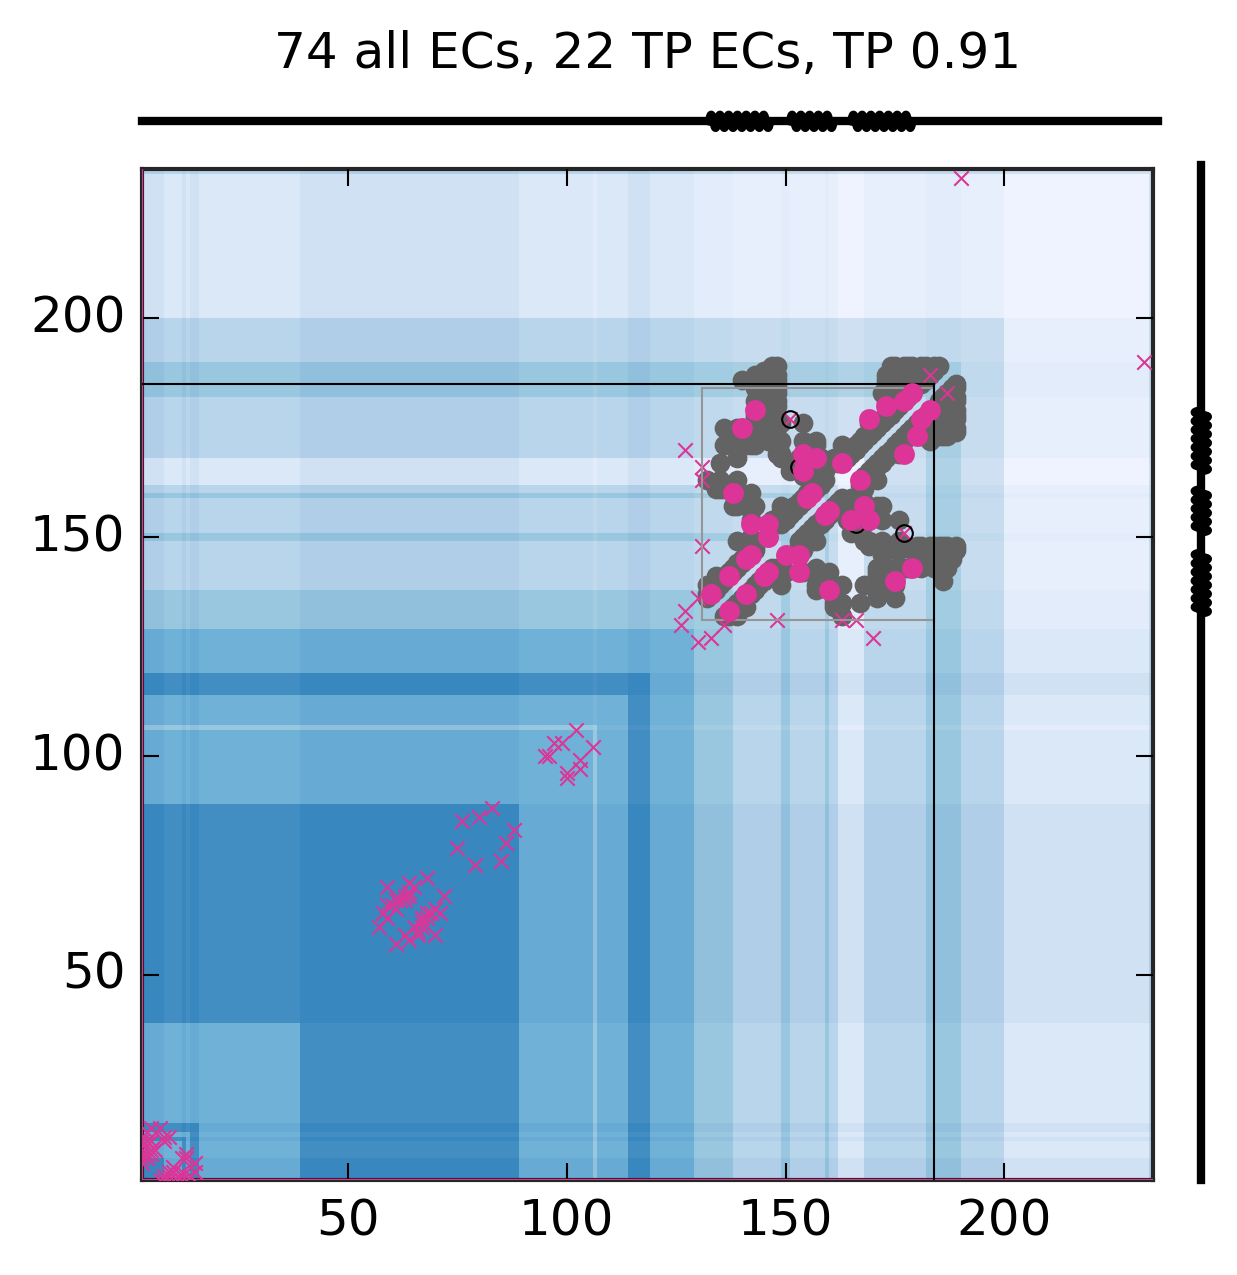
Predicted and experimental contacts
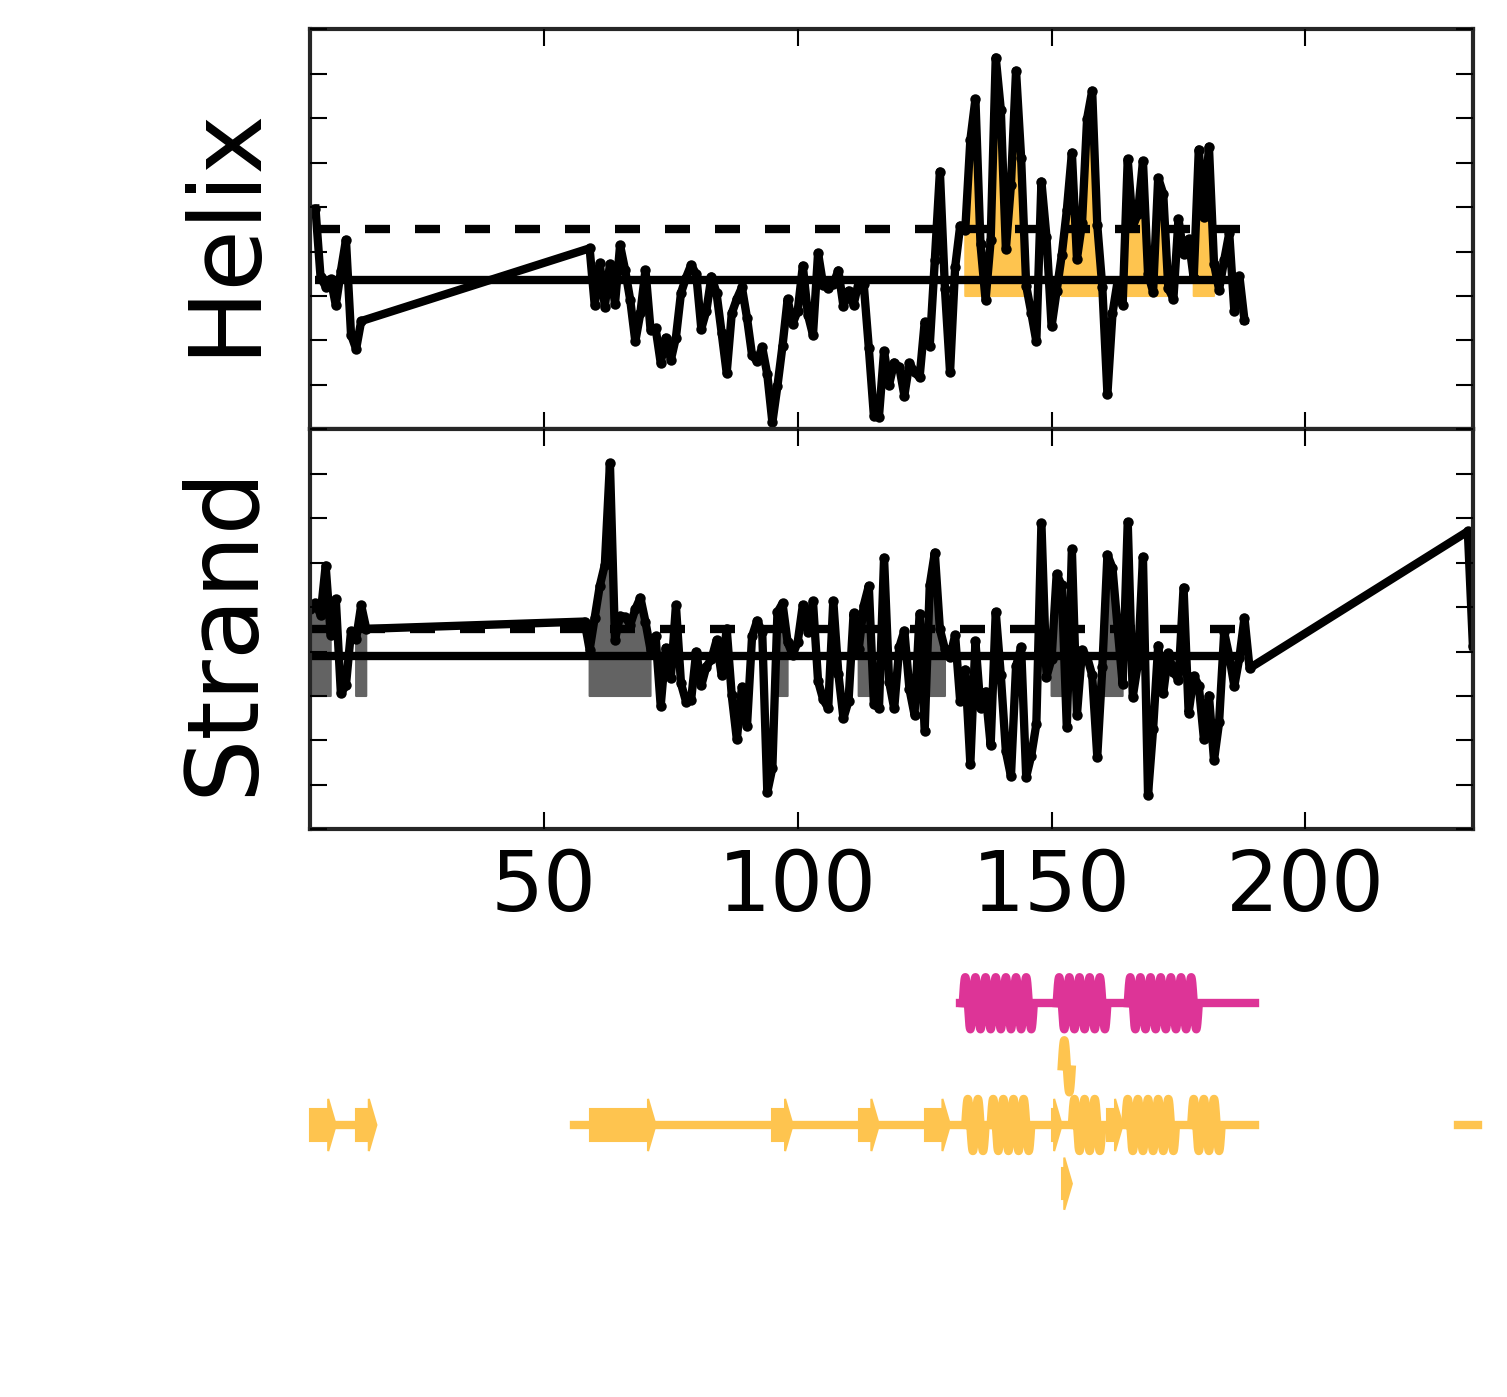
Secondary structure from ECs
EC score distribution and threshold
Top ECs
| Rank |
Residue 1 |
Amino acid 1 |
Residue 2 |
Amino acid 2 |
EC score |
| 1 |
140 |
E |
175 |
R |
1.17 |
| 2 |
143 |
F |
179 |
T |
1.12 |
| 3 |
157 |
L |
168 |
V |
1.12 |
| 4 |
3 |
R |
7 |
P |
1.11 |
| 5 |
142 |
K |
153 |
E |
0.96 |
| 6 |
151 |
A |
177 |
Y |
0.93 |
| 7 |
3 |
R |
11 |
E |
0.90 |
| 8 |
141 |
R |
145 |
H |
0.85 |
| 9 |
9 |
P |
13 |
K |
0.85 |
| 10 |
57 |
E |
61 |
E |
0.85 |
| 11 |
5 |
P |
10 |
G |
0.84 |
| 12 |
169 |
K |
177 |
Y |
0.84 |
| 13 |
3 |
R |
8 |
R |
0.83 |
| 14 |
61 |
E |
65 |
G |
0.82 |
| 15 |
156 |
H |
160 |
N |
0.82 |
| 16 |
61 |
E |
67 |
S |
0.80 |
| 17 |
154 |
R |
165 |
E |
0.79 |
| 18 |
131 |
F |
163 |
L |
0.78 |
| 19 |
59 |
E |
63 |
E |
0.77 |
| 20 |
179 |
T |
183 |
Q |
0.77 |
| 21 |
138 |
E |
160 |
N |
0.77 |
| 22 |
154 |
R |
169 |
K |
0.77 |
| 23 |
63 |
E |
67 |
S |
0.76 |
| 24 |
102 |
Y |
106 |
S |
0.76 |
| 25 |
8 |
R |
12 |
A |
0.75 |
| 26 |
127 |
S |
133 |
H |
0.75 |
| 27 |
4 |
V |
9 |
P |
0.75 |
| 28 |
8 |
R |
13 |
K |
0.74 |
| 29 |
4 |
V |
8 |
R |
0.74 |
| 30 |
137 |
I |
141 |
R |
0.73 |
| 31 |
99 |
L |
103 |
L |
0.73 |
| 32 |
127 |
S |
170 |
I |
0.72 |
| 33 |
64 |
G |
69 |
A |
0.72 |
| 34 |
75 |
Q |
79 |
G |
0.72 |
| 35 |
142 |
K |
146 |
Q |
0.72 |
| 36 |
130 |
A |
136 |
V |
0.71 |
| 37 |
153 |
E |
166 |
T |
0.71 |
| 38 |
126 |
R |
130 |
A |
0.71 |
| 39 |
177 |
Y |
181 |
R |
0.71 |
| 40 |
3 |
R |
9 |
P |
0.71 |
| 41 |
60 |
P |
66 |
R |
0.70 |
| 42 |
64 |
G |
68 |
R |
0.70 |
| 43 |
68 |
R |
72 |
Q |
0.70 |
| 44 |
173 |
Q |
180 |
K |
0.70 |
| 45 |
5 |
P |
15 |
E |
0.69 |
| 46 |
76 |
L |
85 |
E |
0.69 |
| 47 |
133 |
H |
137 |
I |
0.69 |
| 48 |
163 |
L |
167 |
Q |
0.69 |
| 49 |
6 |
E |
10 |
G |
0.69 |
| 50 |
155 |
A |
159 |
K |
0.69 |
| 51 |
59 |
E |
66 |
R |
0.69 |
| 52 |
80 |
P |
86 |
E |
0.68 |
| 53 |
131 |
F |
148 |
Y |
0.68 |
| 54 |
62 |
P |
67 |
S |
0.68 |
| 55 |
5 |
P |
9 |
P |
0.68 |
| 56 |
3 |
R |
12 |
A |
0.68 |
| 57 |
131 |
F |
166 |
T |
0.67 |
| 58 |
58 |
P |
64 |
G |
0.67 |
| 59 |
96 |
E |
100 |
G |
0.66 |
| 60 |
63 |
E |
68 |
R |
0.66 |
| 61 |
146 |
Q |
153 |
E |
0.66 |
| 62 |
83 |
A |
88 |
E |
0.66 |
| 63 |
7 |
P |
15 |
E |
0.66 |
| 64 |
59 |
E |
70 |
G |
0.66 |
| 65 |
64 |
G |
71 |
A |
0.66 |
| 66 |
4 |
V |
12 |
A |
0.66 |
| 67 |
65 |
G |
70 |
G |
0.66 |
| 68 |
97 |
R |
103 |
L |
0.66 |
| 69 |
95 |
P |
100 |
G |
0.65 |
| 70 |
190 |
D |
232 |
A |
0.65 |
| 71 |
146 |
Q |
150 |
S |
0.65 |
| 72 |
183 |
Q |
187 |
E |
0.65 |
| 73 |
5 |
P |
12 |
A |
0.65 |
| 74 |
4 |
V |
14 |
A |
0.65 |
Alignment robustness analysis
First most common residue correlation
Second most common residue correlation